
Tarck Community Health Report 2019

New Tarck is one now. I think it's a good interval to reflect on community health and growth since we've moved to Discourse.
To save time I am going to just post the discourse populated graphs. For posts I am going to quote from last years post.
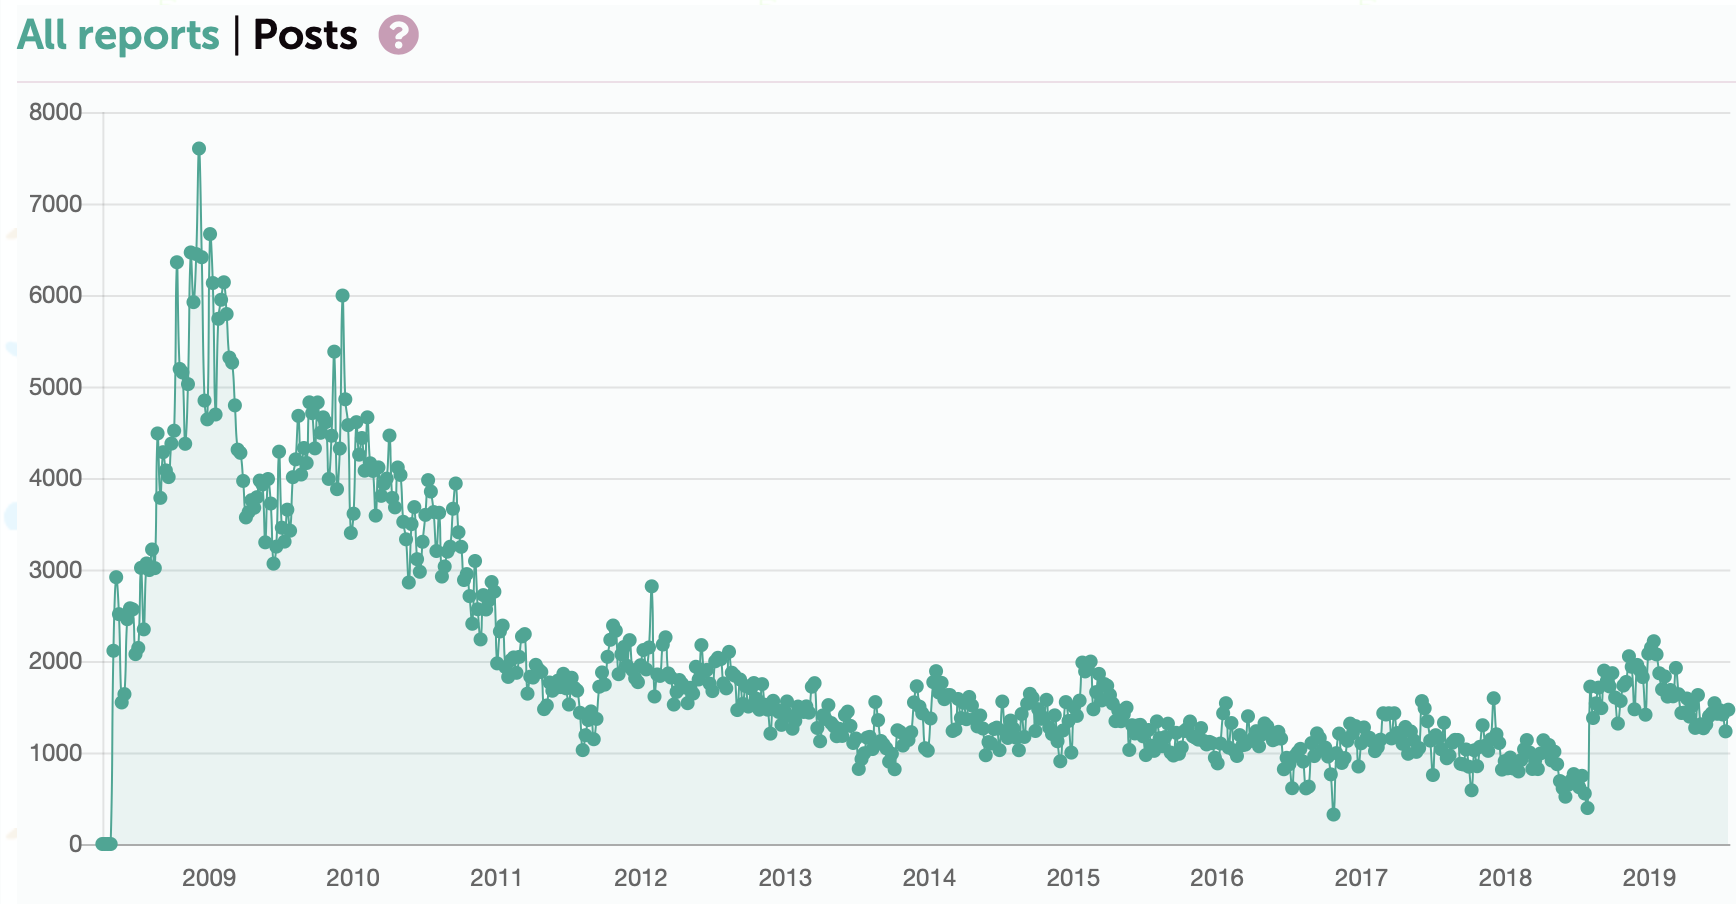
The most active day ever on tarck was December 4, 2008. 1,570 posts were made that day. The average posts per day was 583 in 2008. 2009 had an average daily post of 655. 2010 was 524. 2011 was 282. 2012 was 284. 2013 was 196. From there the trend levels out for the most part. Declining about 20 posts per day, per year. When Tarck went dark on July 24, the average posts per day in 2018 had sunk to 128.
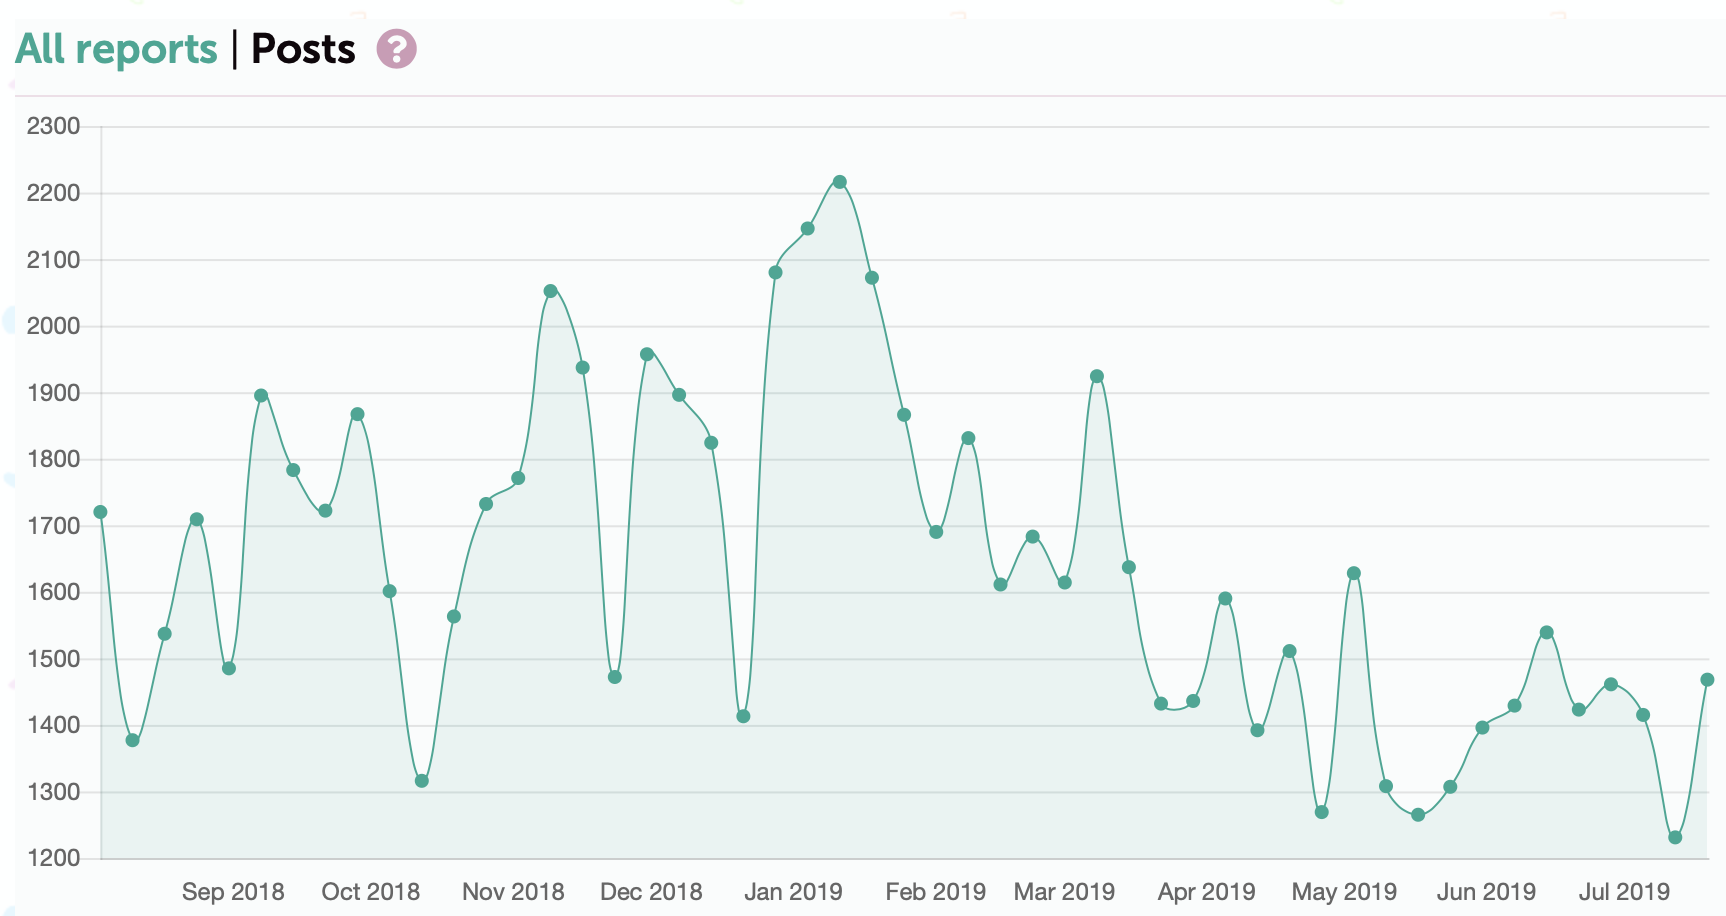
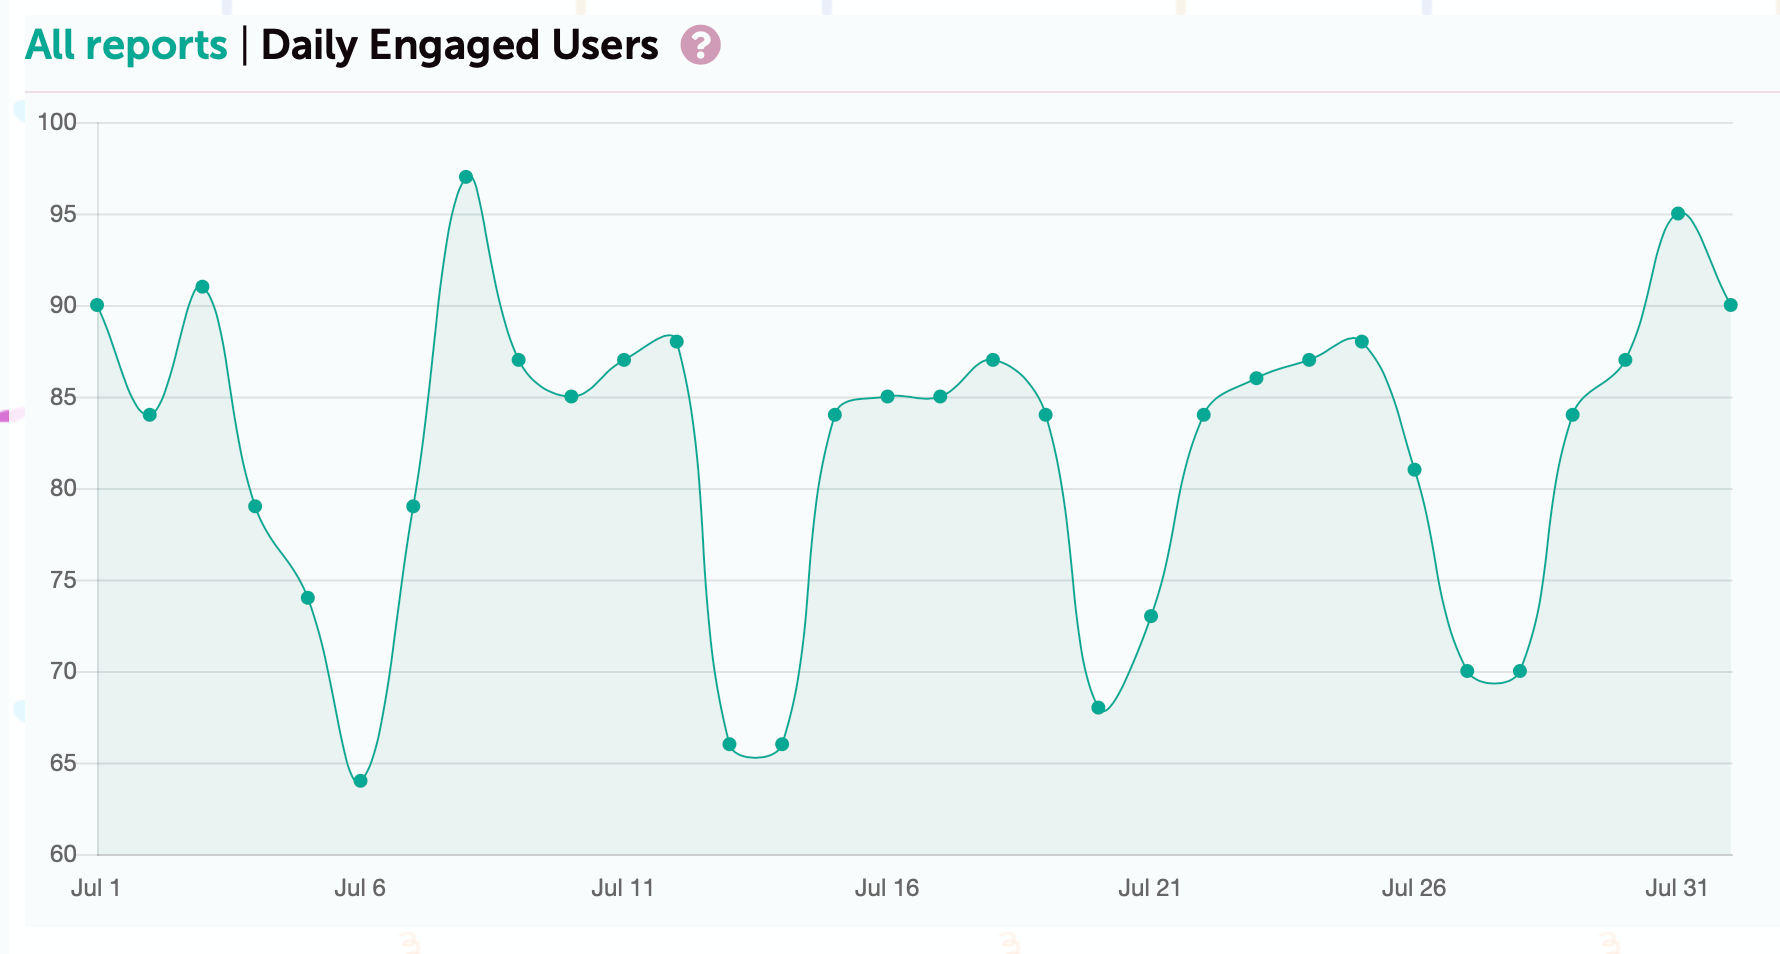
Currently we are averaging around 250 posts per day. That is up from old Tarck's 128 per day by a lot. If you zoom into just this past year you can see that the number of posts varys a lot. It looks like we are starting to sag in engagement but that is not backed up by the engaged users list.
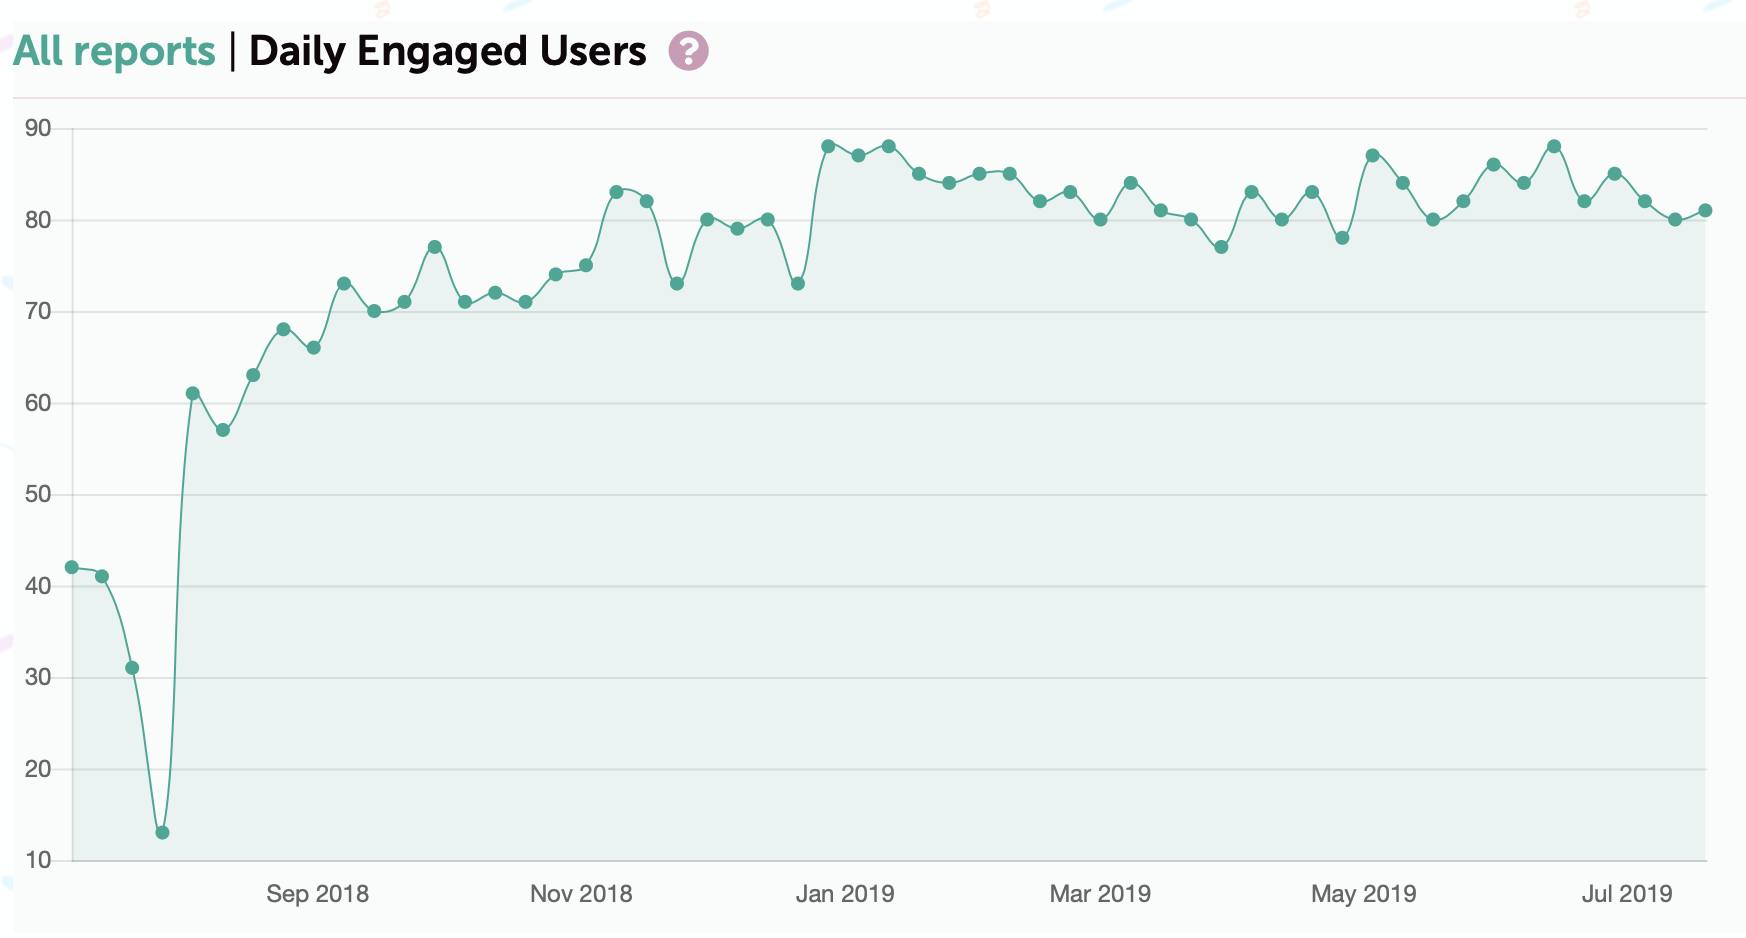
We are still seeing a rise in engagement even with what appears to be a drastic drop in posts. I think this is because even though people are visiting Tarck they are posting less. This generally increases in the winter and we will see how it fairs next year.
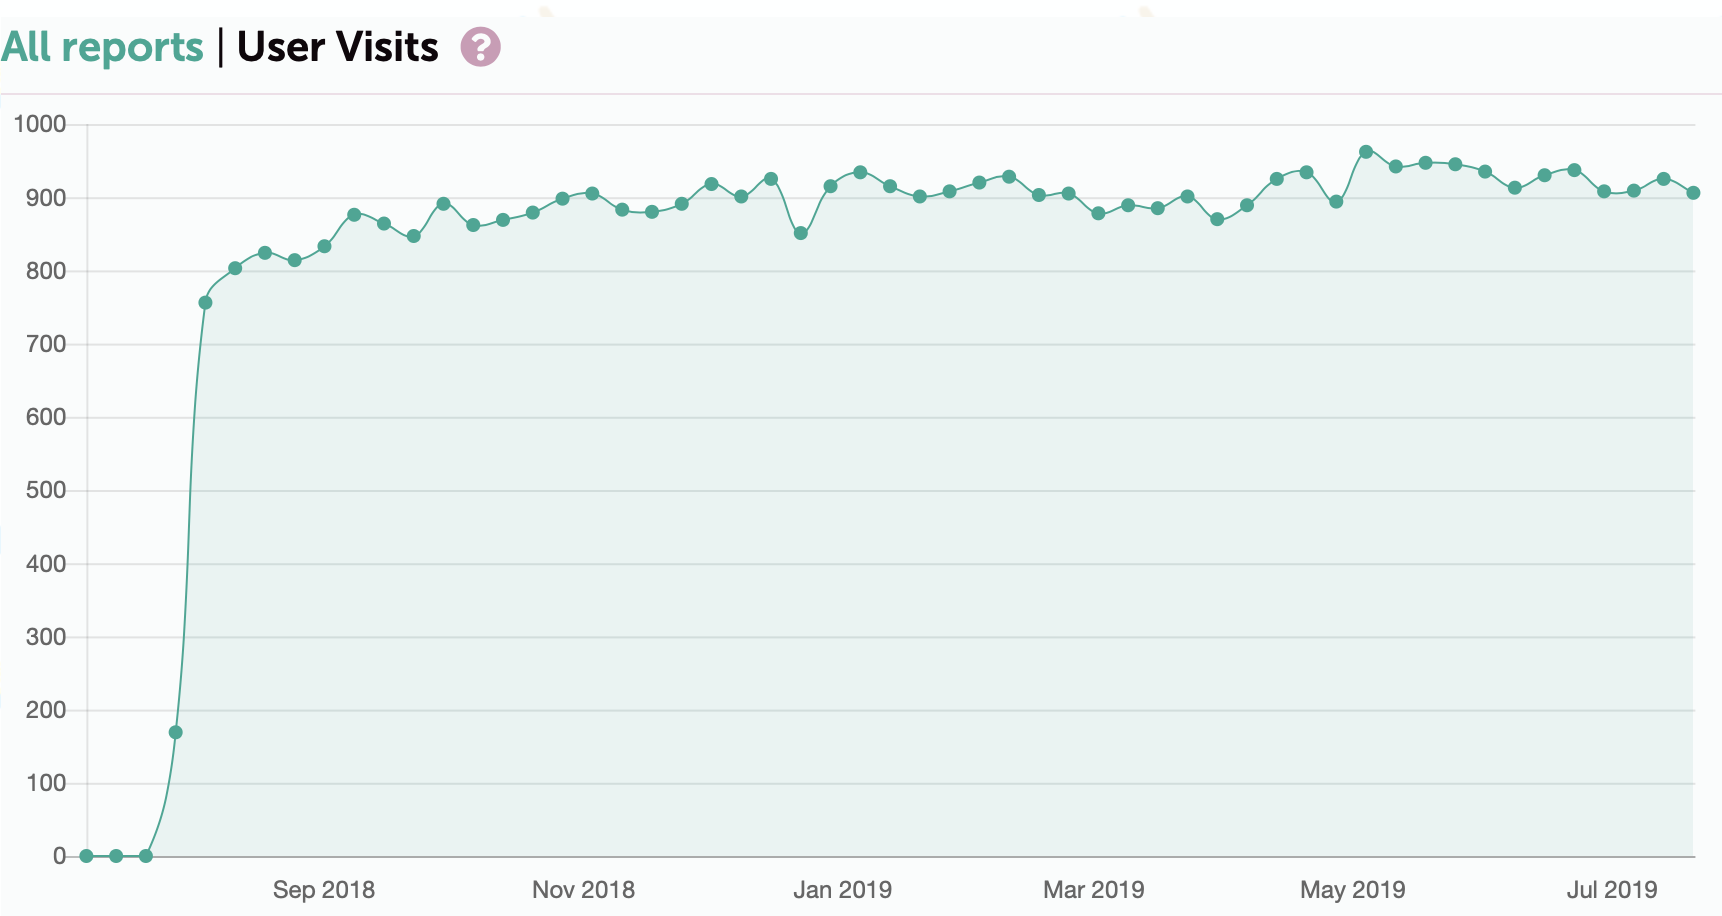
One thing we can track now is user visits. This is a pretty clear slow rise in visits. We average between 130-150 logged in users per day. This is different from engaged users because this just tracks a logged in user. An engaged user is somebody that logs in and does something. Whether it's PM somebody, like a post or make a post they have 'engaged' We are seeing block averages increas by ~10% since last year.
If we pop open Google Analytics we can see that the average user sessions is 12 minutes. And on average a person views 11 pages. With discourse I have no idea how accurate that is.
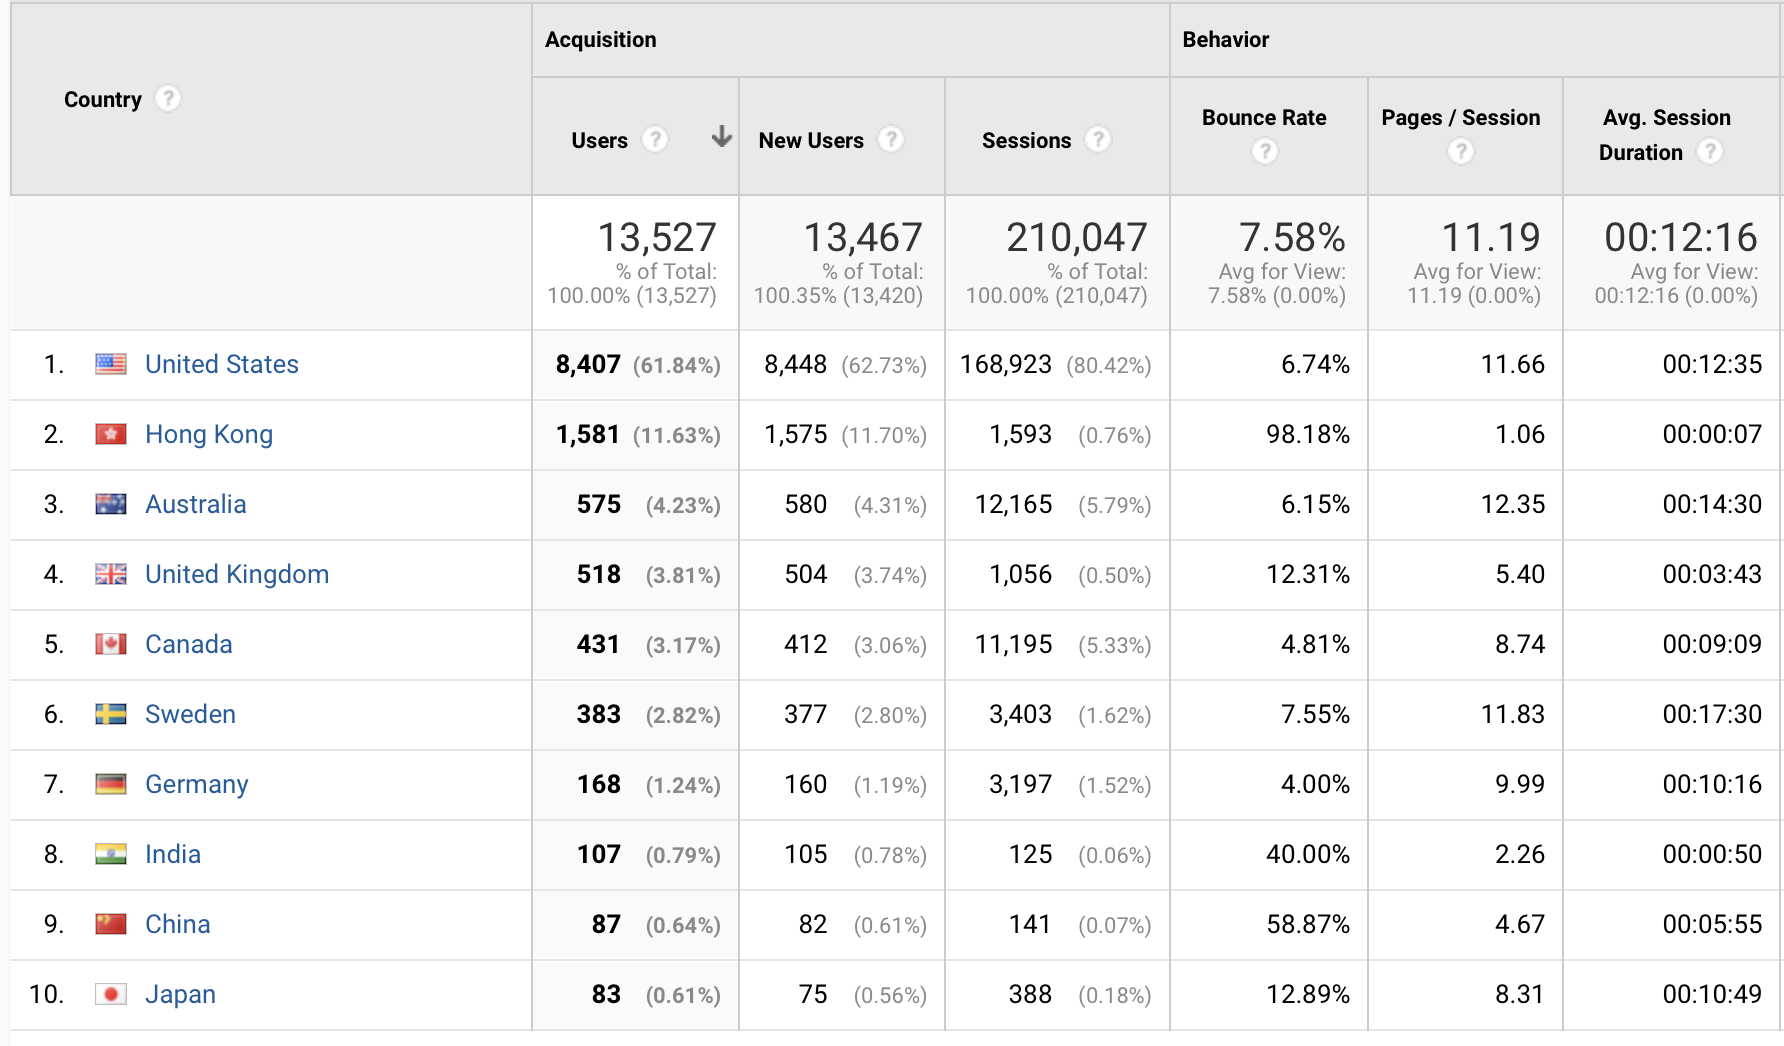
If we look at the country spread we can see that we have a lot of traffic from Hong Kong but as far as I know we don't have any users currently living there. The bounce rage is also nearly 100% so that's neat. Otherwise it doesn't reveal anythig we didn't all know. We have a lot of traffic from english speaking countries with a strong Swedish contingent.
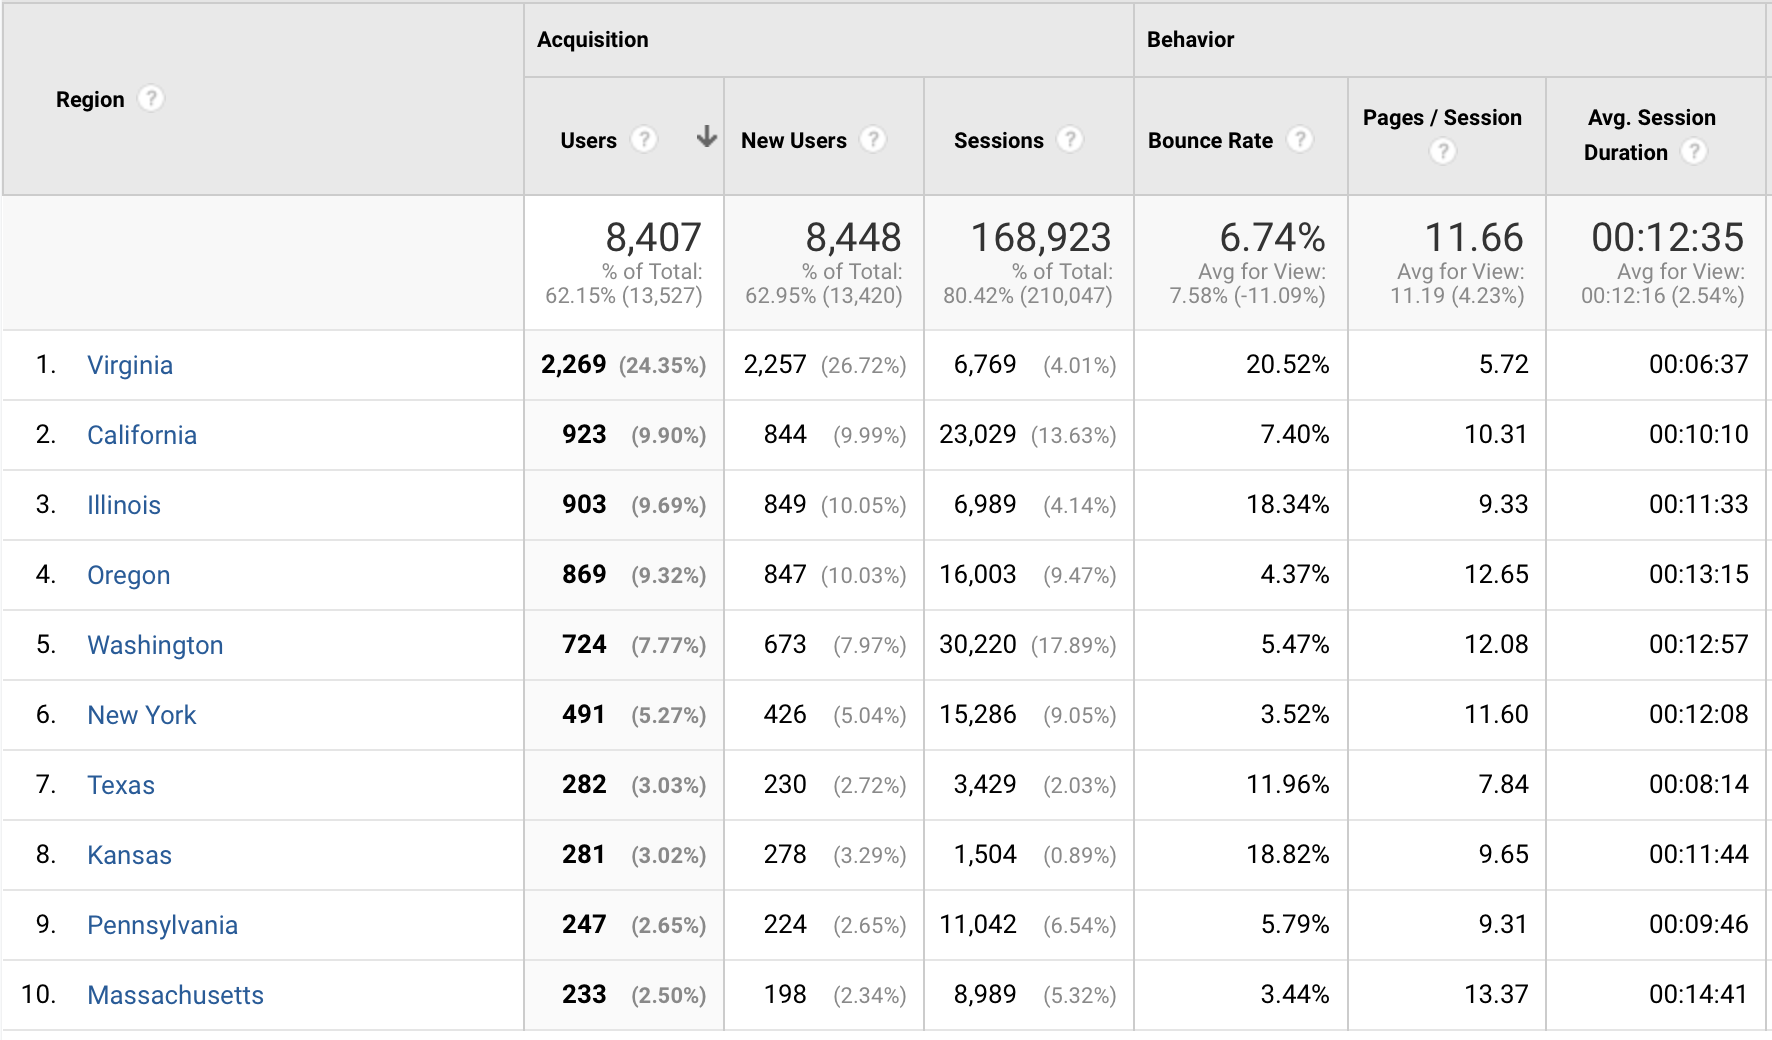
If we zoom into state-level we can see that Braden spends a shit ton of time on Tarck. Actually I assume we are getting pinged but something in Virgina because the bounce rate is atypically higher than most other states.
Anyways, we have some growth since last year, but overally Tarck has seen a good amount of growth in both users and engagement since 2 years ago. We are still not as big as 2008 but we are a lot more woke.
If anyone wants to see any form of data export just let me know and I will spit that out.